Is the Montreal Metro Profitable?
July 6th, 2017 by ant6n
Recent discussions about transit and profitability seem to imply that a transit system could be profitable if you privatize and automate it. This led me to wonder whether the Montreal Metro, a semi-automated system, is actually profitable.
From an accounting perspective, profitability is simple: add up the revenues and the costs of doing business, and if your revenues exceed your costs, you’re profitable.
I don’t do this with a view of exploring the merits of subsidies, but with a desire to get a more accurate accounting of the cost of transit, in particular comparing different modes of transit.
A transit system generates revenues through fares and other activities like selling ad space (other revenues). Costs include not only operations (ongoing labour, maintenance, energy/gasoline, etc.), but also capital expenses (building new lines, buying trains/buses, major renovations, technology upgrades like the Ibus tracking and fleet management system, etc.). A transit system also receives subsidies (which it counts as revenue) because fares generally don’t cover operations and capital expenses.
The STM’s numbers are easily found in their budgets, Which gives us the totals for costs and revenues of the bus and metro system.
The budget pools together paratransit, bus and metro, so if we only want to calculate the profitability of the metro, we’ll need to split up the costs and revenues by mode. Also, the investments shown in the operating budget do not include all the capital costs of the STM, so we will need to find those numbers as well.
To be able to compare the revenues and costs across the different systems with different number of passengers engaging in trips of different lengths, we need a common measure that accounts for these differences. One such measure is the passenger-km, which represents the total number of kilometers all passengers are travelling in the system. It provides a good way to compare the revenues and costs across different networks, and provides a common point of reference when discussing profitability and subsidies.
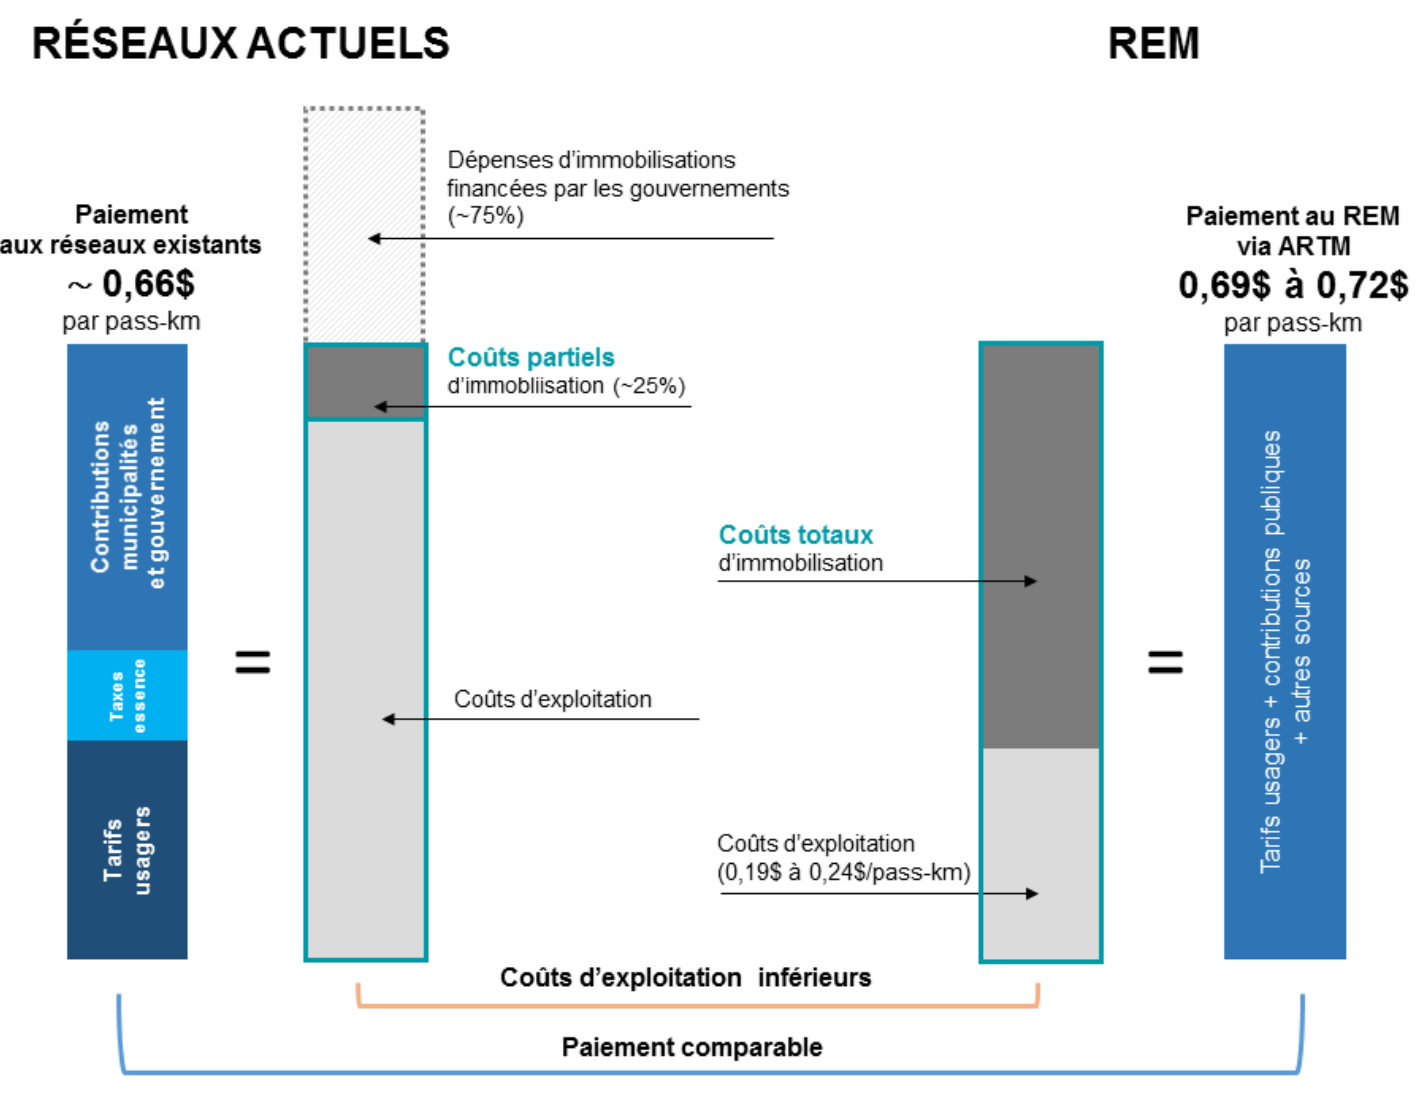
An example of the use of passenger-km (or pass-km) is in the following chart published by CDPQInfra, the promoters of the REM, to compare costs and subsidies of the REM and the existing networks in Montreal.
Back to Metro profitability, we will need to do the following:
- Find the passenger-kilometres of the STM and how they are split between the bus and metro
- Divide the cost of operations between bus and metro
- Divide the revenues between bus and metro
- Divide capital costs between bus and metro.
- Divide all the costs by the total passenger-kilometres.
In order to make numbers more comparable, we will exclude paratransit. I’ll show my calculations for the year of 2015, but numbers don’t change much during the years.
If you’re not interested in the detailed breakdowns, you can skip ahead to the result:
- 1) Passenger-Kilometers of the STM
- 2) Cost of Operations of Bus and Metro
- 3) Revenues of Bus and Metro
- 4) capital cost
- The Results
- Conclusion
1) Passenger-Kilometers of the STM
The STM publishes very little information about the passenger-kilometers they achieve. Luckily we have access to the Canadian Public Transit Association (CUTA) factbook, which provides this number. According to the CUTA factbook of 2015, the STM moved passengers a total of 3.45 billion km.
Unfortunately, we are still left with the problem of splitting the kilometres between the bus and the metro. There is almost no information available about this. After much searching, the only reference I found is in a 2013 presentation given by the STM at a conference in the Czech Republic. It indicates that the metro accounts for 64% of the passenger kilometers of the system. This number is a few years old, but it still provides the best estimate for our calculations — even if the total ridership has changed, the proportions are likely similar.
| Passenger-Kilometers of the STM | |
|---|---|
| metro passenger km | 2,211 million km |
| bus passenger km | 1,243 million km |
| total passenger-km | 3,455 million km |
2) Cost of Operations of Bus and Metro
The budget of the STM provides the the following revenue and cost summary in their 2015 budget (page 10):
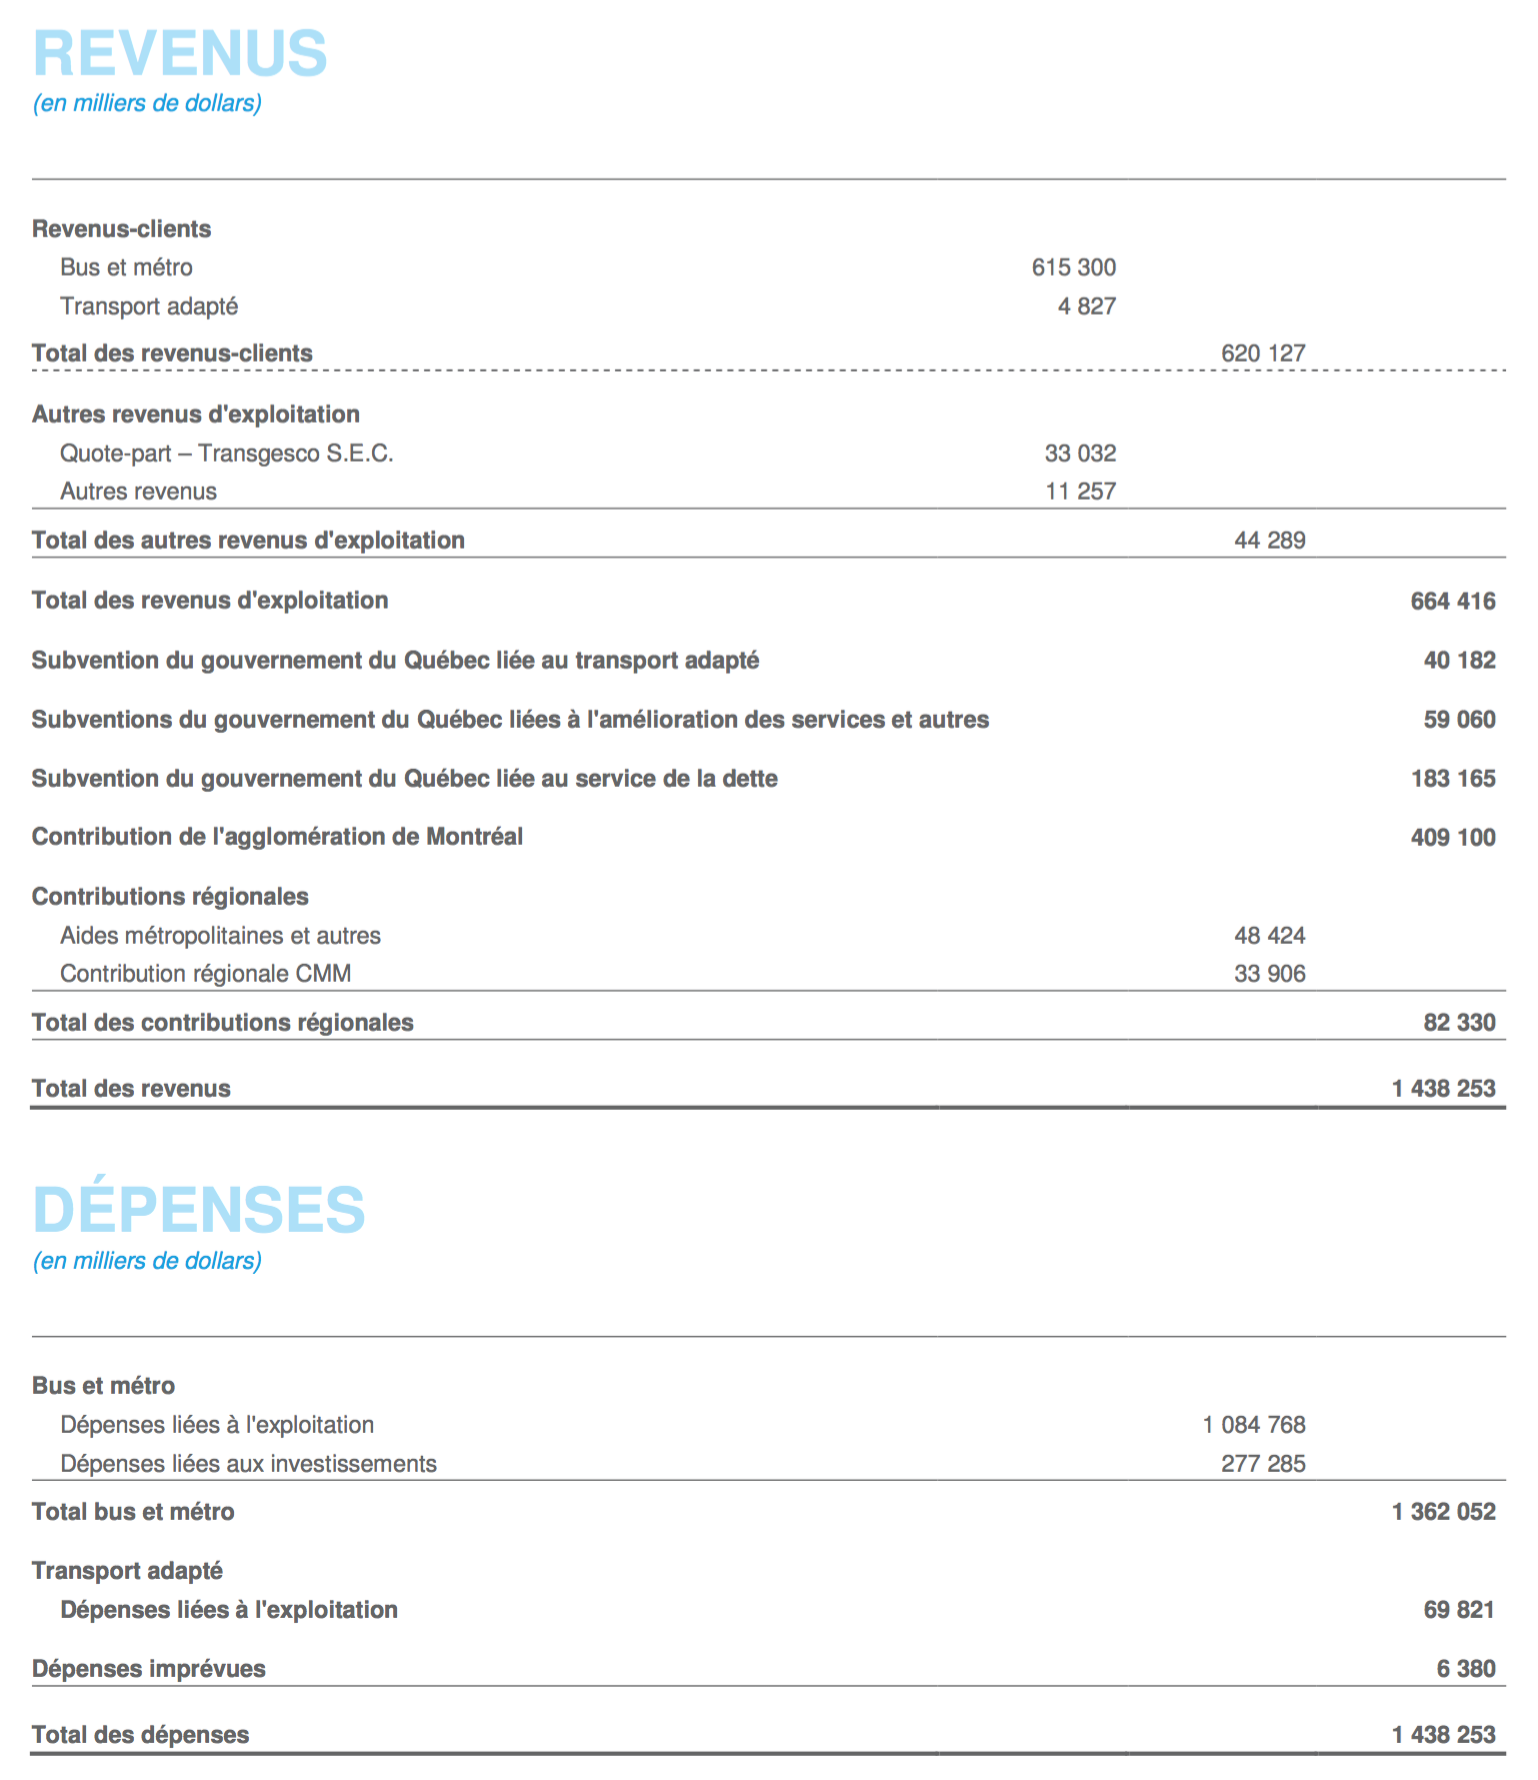
On the revenue side, we see plenty of income from fares, but also a lot of subsidies.
On the expenses side, most of the money is spent operating the bus and metro, but a large chunk also goes towards paratransit. The budget also includes some investments (capital costs).
To split the costs by metro and bus, we can look further in the budget, where the STM provides a breakdown of operating costs by administrative unit (page 61):
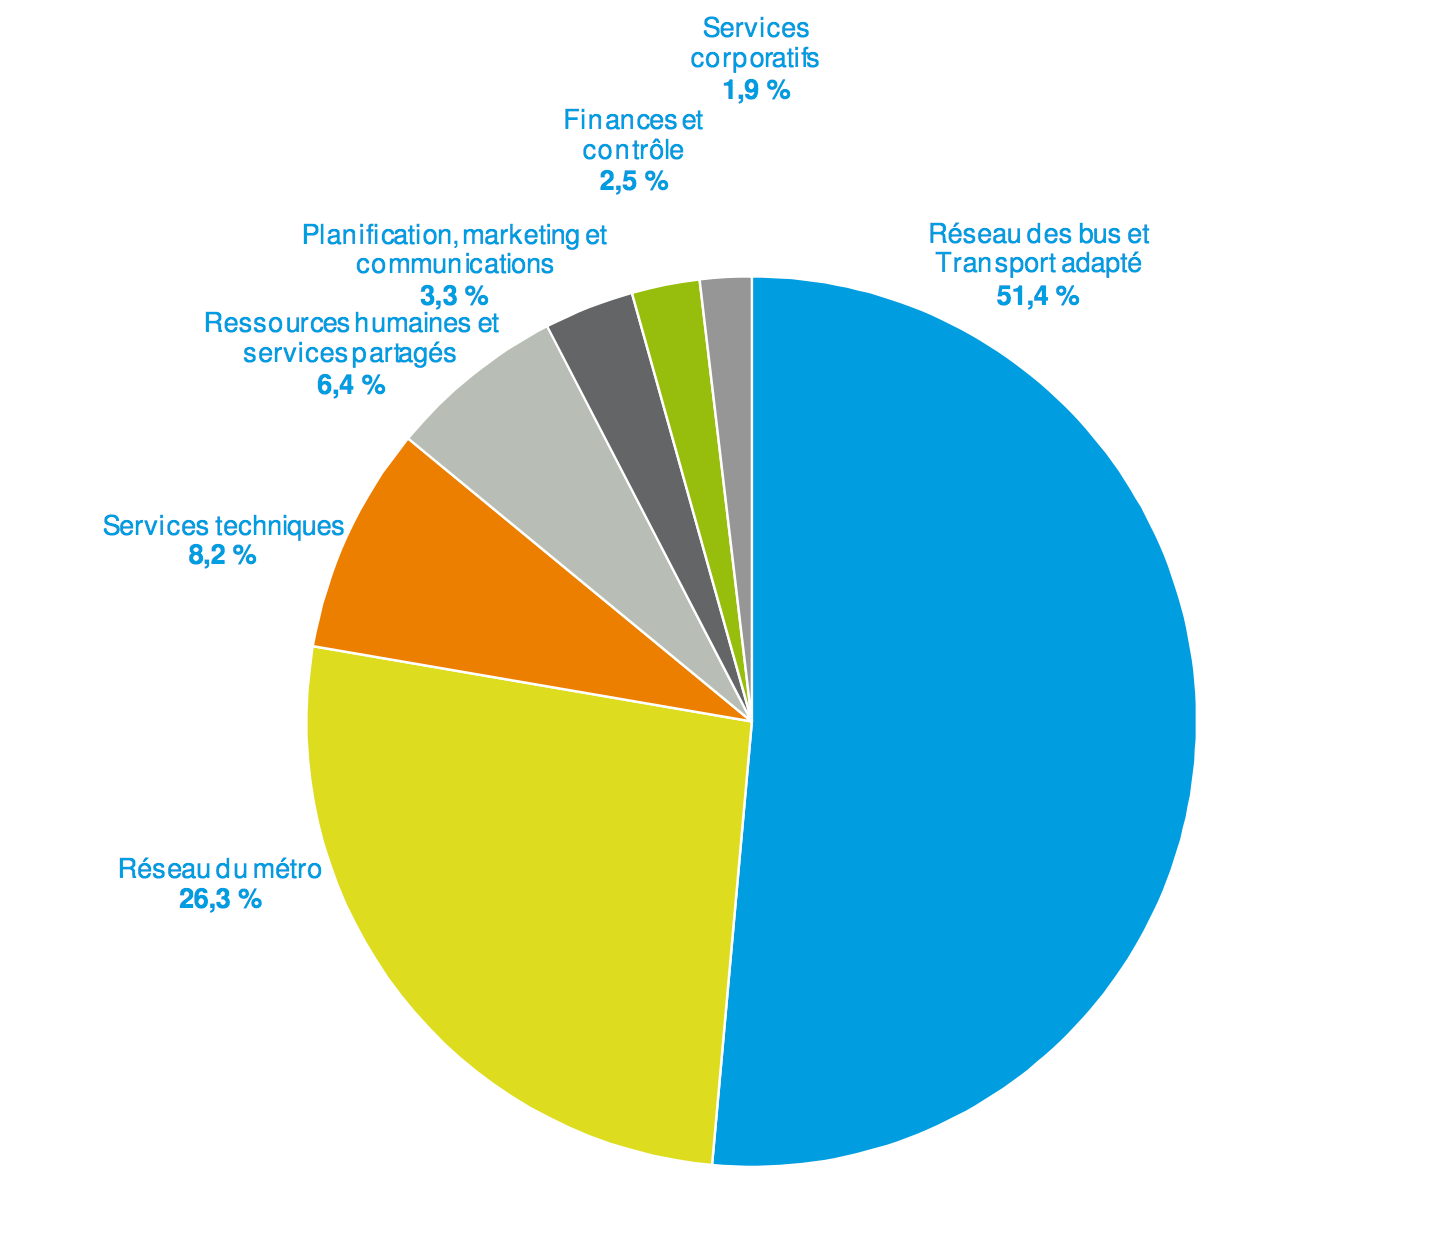
Luckily for us, the operating costs of the metro is shown separately from bus and paratransit. However, to get the complete picture, we have to figure out how to allocate the cost not directly associated with the metro or bus system, but represents services shared between them. In the absence of specific information, the best we can do is find a reasonable split. On the one hand, the metro transports more passengers and is generally more technically complicated to operate than buses. On the other hand, the bus network has twice the numbers of employees (page 62 in 2005 budget) and costs twice as much to operate compared to the metro. Considering this, I decided that splitting the shared services 40% for the metro and 60% for the bus was reasonable.
Strangely, the costs shown in the STM chart do not add up to the budget’s total operating cost but we will ignore this for our calculations.
| Bus & Metro Operating Costs of the STM (2015) | |
|---|---|
| metro | 405M$ |
| bus | 679M$ |
| bus & metro | 1,085M$ |
3) Revenues of Bus and Metro
The next step is to allocate the revenues between the metro and bus, as they are reported together in the STM budget. Again, this is not a trivial task.
To illustrate the complexity, imagine a passenger purchases a single ticket and takes a bus for 2 km, then the metro for 6km, then another bus for 2km. How should we split the fare between the bus and metro? Should we split the fare 60/40 based on the number of travelled kilometers? What if the passenger transfers from one metro line to another? Or 50/50 between bus and metro? Or 33/66 because the metro was taken once, but buses were taken twice (or, in industry terms, “by boardingâ€)? What if the passenger transferred from one metro line to another?
To answer this question, I tried to find out how the STM and agencies share revenues for passes that span multiple transit agencies. I found that a hybrid is used: for TRAM monthly passes covering multiple agencies, the first 23.75$ are shared in proportion to the number of trips, the remainder according to passenger-km travelled (budget 2015, page 141). I applied a similar sharing model to the calculations, and allocated 20% of the revenues by boarding and the rest by passenger-km.
While analyzing revenue-splitting, I considered factoring-in the type of tickets to get more accurate numbers. Analyzing STM OPUS card tap-in data, I found that there are more single and short term tickets used on the metro compared to the bus, which in turn sees more weekly and monthly passes. This may be relevant, since single tickets bring in more revenue per trip compared to pases. On the other hand, the Metro sees more monthly passes that are shared with other agencies (TRAM passes), which complicate revenue allocations.
Without being able to model these accurately, we’ll simply assume that the usage of different tickets across the different networks has a negligible impact on revenue.
| Bus & Metro Revenue (2015) | |||
|---|---|---|---|
| per boarding | per km | combined | |
| metro | 384 M$ | 422 M$ | 415 M$ |
| bus | 275 M$ | 237 M$ | 245 M$ |
| total | 660 M$ | 660 M$ | 660 M$ |
4) capital cost
Capital costs are the big one time costs used to build lines, upgrade them or make large renovations.
It is possible to trade operating costs for capital costs — for example, a system could decide to spend a lot of money to replace an expensive-to-operate heavily used bus line with an automated light metro line, which may reduce the number of staff required and thus the operating cost – but requiring a lot of capital expenditure.
On the other hand, a system could decide to never build capital-intensive rail lines at all and transport everybody by bus all the time. Then the capital costs will be much lower (since you basically only need the buses and garages), but the operating costs will be very high.
So in order to get a complete picture of the total cost of running transit, we need to consider the capital costs.
Generally, we expect the capital costs for a metro system to be large due to the expensive infrastructure, and the capital costs for a bus system to be small. For the operating cost it’s the other way round — and depending on how many users there are running on the line, the total cost of one or the other may be cheaper per passenger.
Figuring out how to count the capital costs can be quite tricky. Some investment spendings come out of the operating budget. Capital spending may vary from year to year, depending on the construction projects. Capital costs are also often paid via debt, which then spreads the costs over many years and makes it hard to identify when the costs happen.
From an accounting perspective, there are two approaches to counting the capital costs: when the money is made available and when it is spent. Both approaches have shortcomings, as debt makes it hard to track when the money for capital projects is paid out. The STM budget also doesn’t provide a detailed view to track this information. Further, it’s impossible to split the information to bus and metro spending.
Tracking when the money is spent is much easier: each year there is a capital budget, and there is even a listing of the projects where most of the money is spent. This allows to differentiate bus and metro spending. The problem is that this pretends that the capital cost of the system is only due to projects that are being done in one year, when in reality most of the capital spending may have been done in the past, with the debt being paid off slowly.
Looking at the capital budget over multiple years, we see that the spending has been relatively constant, around 600M$ per year (although there were some spikes in recent years due to the purchase of new metro cars). Also consider that the only metro extension in nearly thirty years, the 2007 Laval extension of the Orange line, cost 745M$ in total — not much more than a single year of capital budgets now.
The capital budget can be relatively easily split into bus and metro, since most of the budget is for major projects:
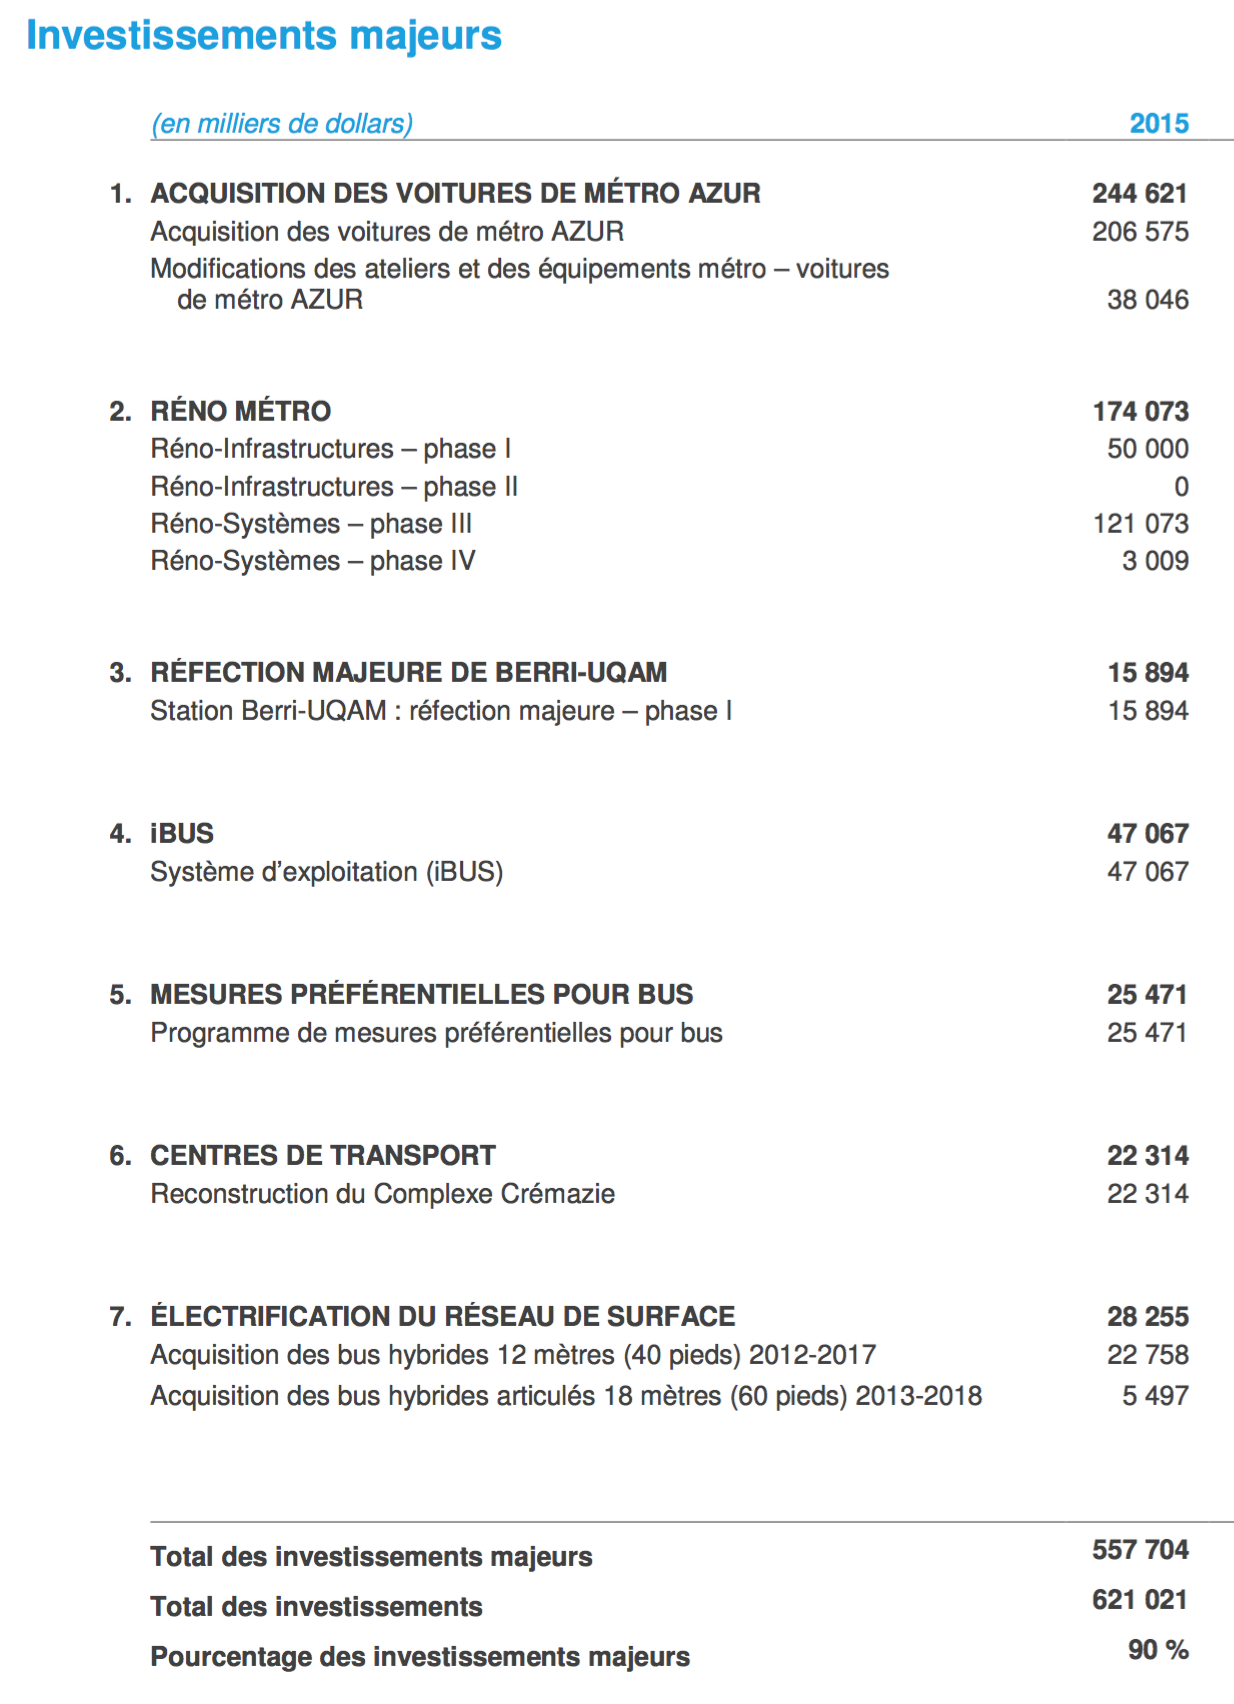
It seems overall, using the year-of-expenditure view of capital cost provides a reasonable approximation of the total capital cost of the system, and allows us to break it down into bus and metro spending.
The Results
Putting all of these numbers together, we’ll get the following results:
| Bus & Metro Cost & Revenue per Passenger-km (2015) | |||
|---|---|---|---|
| Metro | Bus | Overall | |
| revenue (per passenger-km) | 18.7c | 19.7c | 19.1c |
| operating cost (per passenger-km) | 18.3c | 54.6c | 31.4c |
| capital cost (per passenger-km) | 21.4c | 11.9c | 18.0c |
| total cost (per passenger-km) | 39.7c | 66.5c | 49.4c |
As expected, the metro is cheaper to operate, but the capital costs are higher, compared to the bus. The capital costs for the STM bus system actually seem a bit high — this may be due to large bus infrastructure projects going on right now, work on garages and updated real-time tracking systems.
Also note that the bus has more revenue per kilometre. This is because metro trips are longer on average compared to bus trips, ever since the metro extension to Laval (page 20).
Conclusion
We find that the metro is barely profitable operationally. Since the subsidies are provided to both the metro and the bus system, we could claim that the metro is profitable after subsidies, and that these profits are used to subsidize the capital costs of the metro, or more likely, the operating costs of the buses.
One important thing to remember is that the STM forms a system of buses working together with the metro. Many passengers use buses to get to the metro, meaning the buses extend the reach of the metro. Without the feeder buses, the metro could not attract enough riders to be profitable.
So we can say overall that the metro is operationally profitable but only if we ignore the help of the feeder buses.
See the detailled spreadsheet for all the data.
One thing I found during this work is that the story could change if the numbers were picked slightly differently, if I made different choices and assumptions. It would be possible to make the metro look unprofitable or make it look much more profitable, by changing the way costs and revenues are split between buses and metro, or if one were to sneak the cost of paratransit into the equations.
So if somebody provides numbers like this, it’s important that they publish their assumptions and calculations alongside it.
This brings us back to the graph made by CDPQInfra, the private promoters of the REM. Firstly you can see that the Montreal metro is as cheap or cheaper to operate than the fully-automated REM would be in the future (19c vs 19-25c).
But also, note that both the Metro system itself and the STM overall are cheaper to operate than whatever ‘existing networks’ CDPQInfra presents, and that the total cost including capital costs is much lower as well. They are showing numbers without providing the details of their calculations, trying to tell a story that may not withstand scrutiny.
This is a bit concerning, because their whole story of profitable transit, which is presented as having the same overall cost as the existing transit lines, is used to justify important policy decisions and spending of large amount of public money.
July 6th, 2017 at 14:44
I once did a similar exercice and came to similar conclusions… however, I would point out that if operating costs tend to be pretty stable year over year, the same is not true for capital costs that fluctuate wildly year-to-year. Currently, the metro is getting lots of capital money because of the incoming Azur trains and long-delayed station overhauls, but that wasn’t true a few years back. I think that by using the current capital investment for just one year, you have severely overestimated the capital cost of the metro system. I’d like to provide a better image, but I fail to see how I can do so effectively.
July 6th, 2017 at 14:51
As I noticed in the article, the numbers don’t change much over the years. The linked spreadsheet shows multiple years. Also note capital cost section “Looking at the capital budget over multiple years, we see that the spending has been relatively constant, around 600M$ per year”.
July 6th, 2017 at 15:52
Doesn’t vary a lot? In 2017, they expect about 580 millions, 1 024 in 2018 and 450 in 2019. In 2011, it was less than 300. And that was still within the 10-year plan of massive investments started in 2011.
From 1995 to 2002, the STM actually had more capital spending on its buses than on the metro, and not by a little. 57,0% of its capital spending went to its bus system, versus 31,6% for the metro. In 2002, they spent only 125 million dollars on capital spending.
I’d give the link directly, but I’m not sure it wouldn’t be caught by the anti-spam system. So just Google “Montage PTI 2003-2004-2005 – STM” and you’ll get the document I found.
For decades, the metro system was under-invested in, leaving us with some of the oldest rolling stock in the developed world for a metro system, now we are catching up to the back log of necessary investments, which imposes a lot of investments over many years.
July 6th, 2017 at 21:41
@simval
Firstly the inflation from 2003 would make 300M to 380M today. Secondly, You have to consider that back then, the STM had about 13% less ridership (and didn’t have the Laval metro), scaling the capital cost by ridership would make it 450M per year. Lastly, the STM accumulated a larg investment deficit before this decade, about 4.3 billion by 2013, that it’s now trying to work off. In most recent years, there was more capital spending, up to 800M.
In the 2016 budget, there’s a graph showing the investment deficit evolution possible over the the next twenty years (page 94), and it shows how with an inveestment of 421M$/year it will slowly increase, and with 691M$/year it will disappear by 2030. Thus, picking 620M$ as somewhere between the steady state and the pay-off rate seems very reasonable to me, especially considering that there are no new lines being built right now.
July 8th, 2017 at 13:01
What an interesting read! Very well thought out research!
August 9th, 2017 at 10:16
Pour votre information.
http://cmm.qc.ca/fileadmin/user_upload/documents/20070223_EntenteDeficitMetro.pdf