The New Yorker: Income Inequality Visualized along New York’s Subway
April 17th, 2013 by ant6n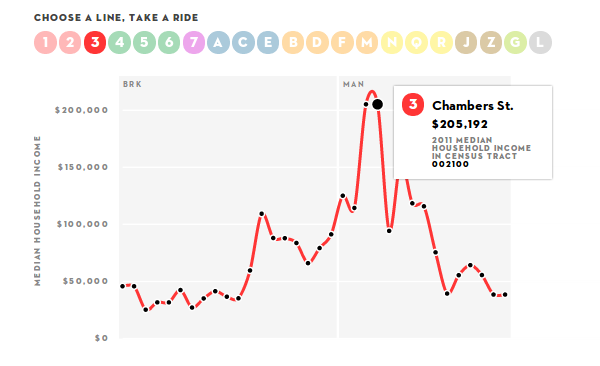
The New Yorker just released this nifty visualization, showing the median household income near New York Subway stations. It’s interactive, letting you click through the system’s lines, showing the the numbers for every stop. The accompanying article explains it as a way to show how the United States, and in particular New York City, has a problem with income inequality:
(…) if the borough of Manhattan were a country, the income gap between the richest twenty per cent and the poorest twenty per cent would be on par with countries like Sierra Leone, Namibia, and Lesotho.
Looking at it from more of a transit angle, for Benjamin Kabak at the 2nd Avenue Sagas the infographic presents a visual case against zone fares. New York’s very large subway system is under a single fare zone, from end to end you can travel more than 50km on a single ride ticket. That would seem unusual from a European point of view, where transit is viewed as something that ideally pays for itself, and distance-based fares are used to bring fares closer in line with the actual cost.
But in New York, as we can see from the interactive infographic, the median household income drops off rapidly as we go away from the center. So distance based fares would disproportionally affect less affluent people, who travel long distances to get to work in the city center, while more affluent people live nearby and only have short rides. The single fare zone is thus seen as a tool in helping the reduce or at least alleviate the income gap problem.
Looking at it from a more urban development perspective, I find the apparent concentration of income brackets problematic. Both concentrating poverty and concentrating wealth are bad for the city, its health, economic activity and liveliness. The city may not be able to improve the wealth distribution of its citizens by much (upper levels of government are generally more effective for that), but maybe it can find more ways to better integrate people of different income levels, give less affluent people access to more neighborhoods and promote mixed-income neighborhoods.
Either way, I was interested to get a better overview of all the data, instead of having to click through the lines one by one. So I went into the code that generates the infographic, and hacked at it a bit to get all of the lines shown on a single graph. All lines are aligned in the center with their wealthiest stop, which also approximately aligns them at the center of the city. The graph goes left to right, generally from Brooklyn/Queens via Manhattan to Bronx/Queens. By showing all the data on a single graph, the problematic distribution of wealth can be seen in a single view:


May 14th, 2013 at 13:44
This is classic bid-rent stuff. Google around for Von Thunen among others.
Flat fares are actually a good way to help with the income inequalities (which I agree are a problem for society and not just NYC).
http://www.answers.com/topic/bid-rent-theory (you can substitute different income groups for the different land uses here – works the same way).\