Explore Two Montreal Transit Maps, 70 Years Apart
March 4th, 2013 by ant6nA zoomable version of two overlayed transit maps from 1941 and 2011 lets you explore the similarities and differences after 70 years of change
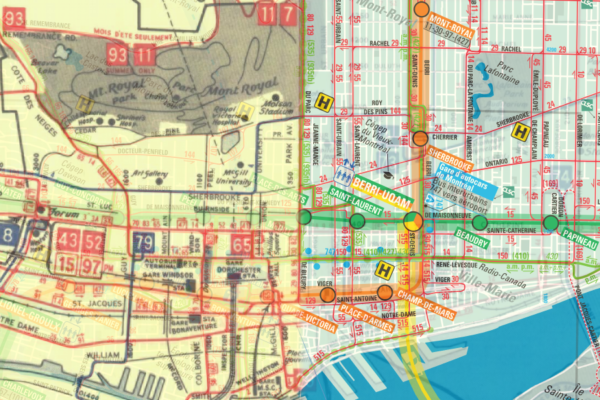
A transit map is not just some means to help people to get around, it can tell you a lot about a city. Where do people live, where do they go, where’s lots of activity. It can be part of the local culture in a way, intimately familiar to so many people. Take two maps, from 70 years apart, overlay them and you can see even more stories emerging. This is what I did with this little mash-up that lets you zoom around a transit map of Montreal from 1941 and from 2011, sliding between the old and the new, and exploring the differences between then and now (a full screen version can be found here).
Many things have changed. Back then, the primary mode of transit was the tram. A system of hundreds of kilometres that has completely disappeared. Today we have the metro, and bus lines on the surface. 70 years ago the city used to be much smaller. Even the island itself was smaller – it grew as garbage got dumped along Pointe-Saint-Charles, and as land was won with the dirt dug up by the metro (or so the lore goes), expanding islands to build parks and expo 67. It seems that the city also used to be more bilingual, with more English street names, and the map itself bilingual.
One thing that I found surprising is how similar the network is today compared to 70 years ago. The tram may have gone, but many of their lines continue to this day, served by buses – despite the lack of tracks, the construction of the metro, and 70 years of change. It seems as if more lines have survived than buildings. Physical constructs made of brick and concrete have gone, whereas lines on a map remained, served by an ever changing fleet of vehicles running transient schedules.
Note how bus/tram-lines survived, whereas heavier rail didn’t. This is a bit surprising because it goes against an idea in transit development today, that rail lines induce more development because people perceive the infrastructure to be more permanent. But in a way it makes sense: if a rail line gets used less and less, it becomes economically impossible to operate. People will also demand the space to be used for something else, perhaps for cars (like the third track on the shoulder of the Victoria bridge), or to expand the city. A street-running transit line, not using any significant space, cheaper to operate and paid within a larger network, can survive as a less and less frequent bus.
Consider the 15 – the line used to be served by trams along the main transit corridor on St-Catherine street. Nowadays it is a bus running in parallel to two busy metro lines, on an awkward not-quite 30 minute schedule, split along two one-ways, routed around pedestrian areas. Today it serves mostly elderly people because the metro is not accessible enough: smack in downtown, it gets only about 8 riders per run*. It has nearly outlived it’s usefulness as a major transit line – a kind of Tomasson?
Other lines that have survived are the busiest in the network. While the busiest line today** (121 Sauvé) didn’t exist back then, many of the busiest routes of today already existed 70 years ago in some form or another (like the 39, 51, 65, 80). Maybe this means that the need to travel along certain directions is ingrained deep in the city structure, which may be stronger than the buildings themselves.
* ~530 people per weekday in 2011, ~64 runs a day, ~8.3 riders per run.** The ridership numbers are from a dump of a few weeks of opus data from 2011.
March 4th, 2013 at 06:34
The stats for the 15 are indeed impressive. What is impressive for me too is the emptiness of subways lines in Montreal. Even during shopping time on week-end Peel, McGill, etc are quiet stations. The only giving a feeling of light crowd sometimes is Berri-UQAM.
March 4th, 2013 at 18:45
Hi,
Great work!
What software did you use to stretch the old map so that it’d overlay correctly over the modern one? Just Photoshop or did you use something fancier like MapAnalyst?
Well done anyway!
Cheers
Herve
March 4th, 2013 at 20:58
@Herve
The background map is in a vector format, and I had it in inkscape, the foreground I had as an image. So I imported the image as a layer in inkscape. I hoped that I would only need to rotate and scale the background map to get a ‘good enough’ match, so I measured the angles of streets in both maps, to find a rotation that would make them match; then tried to scale and move the background to make the maps match.
It didn’t work very well, so I went for a full linear transformation — I recorded the coordinates of intersections in the old and the new map (like ten or so), selecting more in downtown to give that area more weight. This gave me an overdetermined system. Then I used Matlab’s matrix division to find a best fit, giving me a transformation matrix that I applied on the background vector image. It’s not a perfect fit, but it worked surprisingly well, given that the maps surely have different projections, and that the old map appears hand drawn on top of that.
March 4th, 2013 at 21:30
It’s magic! Really well done. The city transport system in time-lapse evolution.
March 5th, 2013 at 03:18
@ant6n I didn’t know about linear transformation matrices, I just looked them up, they look really useful! I learned a bunch just from your two paragraphs, thanks!
March 16th, 2013 at 19:59
Nicely done indeed – fun to compare and a useful research tool as well.
I wonder what you’re thinking of in particular when you say “Note how bus/tram-lines survived, whereas heavier rail didn’t.” The losses of rail lines can be categorized as follows:
– tram lines on private rights of way: these should never have been abandoned; they were too narrow (and unpaved) to run buses on, so the bus lines were downgraded to running in mixed traffic. The most important ones (Millen, Décarie) were finally replaced by metro lines. Lachine without fast trams (or local trains) suffered a multi-decade downturn. The loss of the Montreal & Southern Counties line on the Victoria Bridge led to the refocusing of South Shore development toward Longueuil (metro) and Brossard (Champlain Bridge), freezing Saint-Hubert in mid-development and maintaining the small-town status of Chambly.
– mainline railways: the collapse of the passenger rail system in North America in the 1960s and 1970s also affected Montreal, and all local trains were lost by 1988 except for the Deux-Montagnes and Vaudreuil/Hudson lines. Many have been reestablished since the 1996 creation of the AMT.
Two important factors to consider. Only in the past five years or so has STM ridership reached the levels of the 1950s tram system just before abandonment, despite the fact that the metropolitan population is about three times greater, and the STM service area is much bigger than the area Montreal Tramways covered. There was a drastic collapse of the modal share of public transit that occurred at the time of the abandonment of the tram system, that even the opening of the metro in 1966 hardly affected. (The tram abandonment was not the only cause: this was the time of the mass exodus to the suburbs and the construction of the autoroute system.) The other factor is related to the autoroute system: with so much investment in public highways, it was no longer possible for privately-run passenger trains to compete, and thus they disappeared. It required public support and organization (AMT), not to mention chronic highway congestion, to revive the trains.
March 16th, 2013 at 20:15
I meant the statement as in contrast to the modern perception that ascribes permanency to heavier rail infrastructure compared to, for example, buses (i.e. read the next sentence).
March 20th, 2013 at 21:50
Hey, great post! Where’d you get the 2011 ridership data from?
March 20th, 2013 at 22:23
@Joseph
At some open data hackathon last year, the stm published some opus card data, covering 4 weeks in 2011. I couldn’t find the source of the data again, but I have a copy of it (I’d feel uncomfortable giving it out though). I created a summary of the weekday data on a google spread sheet here. This is just off opus card tap ins, so take that the data with a grain of salt.
March 27th, 2013 at 17:35
Besides opacity, you can try the before/after slider like on http://www.npr.org/blogs/pictureshow/2012/11/02/164194937/interactive-slide-to-see-before-and-after-sandy which uses http://www.catchmyfame.com/2009/06/25/jquery-beforeafter-plugin/
March 27th, 2013 at 17:48
@James
The slider effect can be slick, but I’m a bit concerned it may make the the tool more cumbersome to use, because of the more mouse actions that would be require to switch. Right now it’s just click to go back and forth, which I kinda like. Alex (Dergachev) also told me about the slider 😉
May 14th, 2013 at 21:44
I’m not sure you can even call the ’41 map a projection – it seems distorted in other ways (paper copy in BRS’ Grumley #3) though not as bad as some previous ones.
As much as I love street railways, the “permanence” claim drives me nuts! They are no more permanent than buses as evidenced by the disappearance of several hundred km of routes between about 1935 and 1959! They have certain advantages, but permanence is not one of them!
That said, the permanence of *routes* is apparent from the mashup. Hell, the STM still uses the same numbers for a bunch of routes that have been there since they started numbering c.1923. 80, 17, 11, 55, 58 car lines all still have buses with the same number over at least part of their routes.
About the OPUS data – what percentage of customers still put cash in the farebox? I’ll guess that there are certain groups that are more prone to do this (elderly?) and numbers might get skewed on routes that those groups frequent …
May 14th, 2013 at 22:03
Oh, another thing. The autoroute building came along long after the automobile had taken over. Look at the 47/48/49 aerials to see that it started with improvements to the existing highways (Hwy 2 being twinned even then along the Lakeshore, brand new traffic circles at either end of Cote de Liesse, Hwy … whatever became 117 north from the Decarie circle) not to mention urban boulevards being created from existing streets – Dorchester, Jean Talon, etc.